The Home page
Home is your overview of everything you can reach. Open it from the Home tab or by clicking the Detect logo.
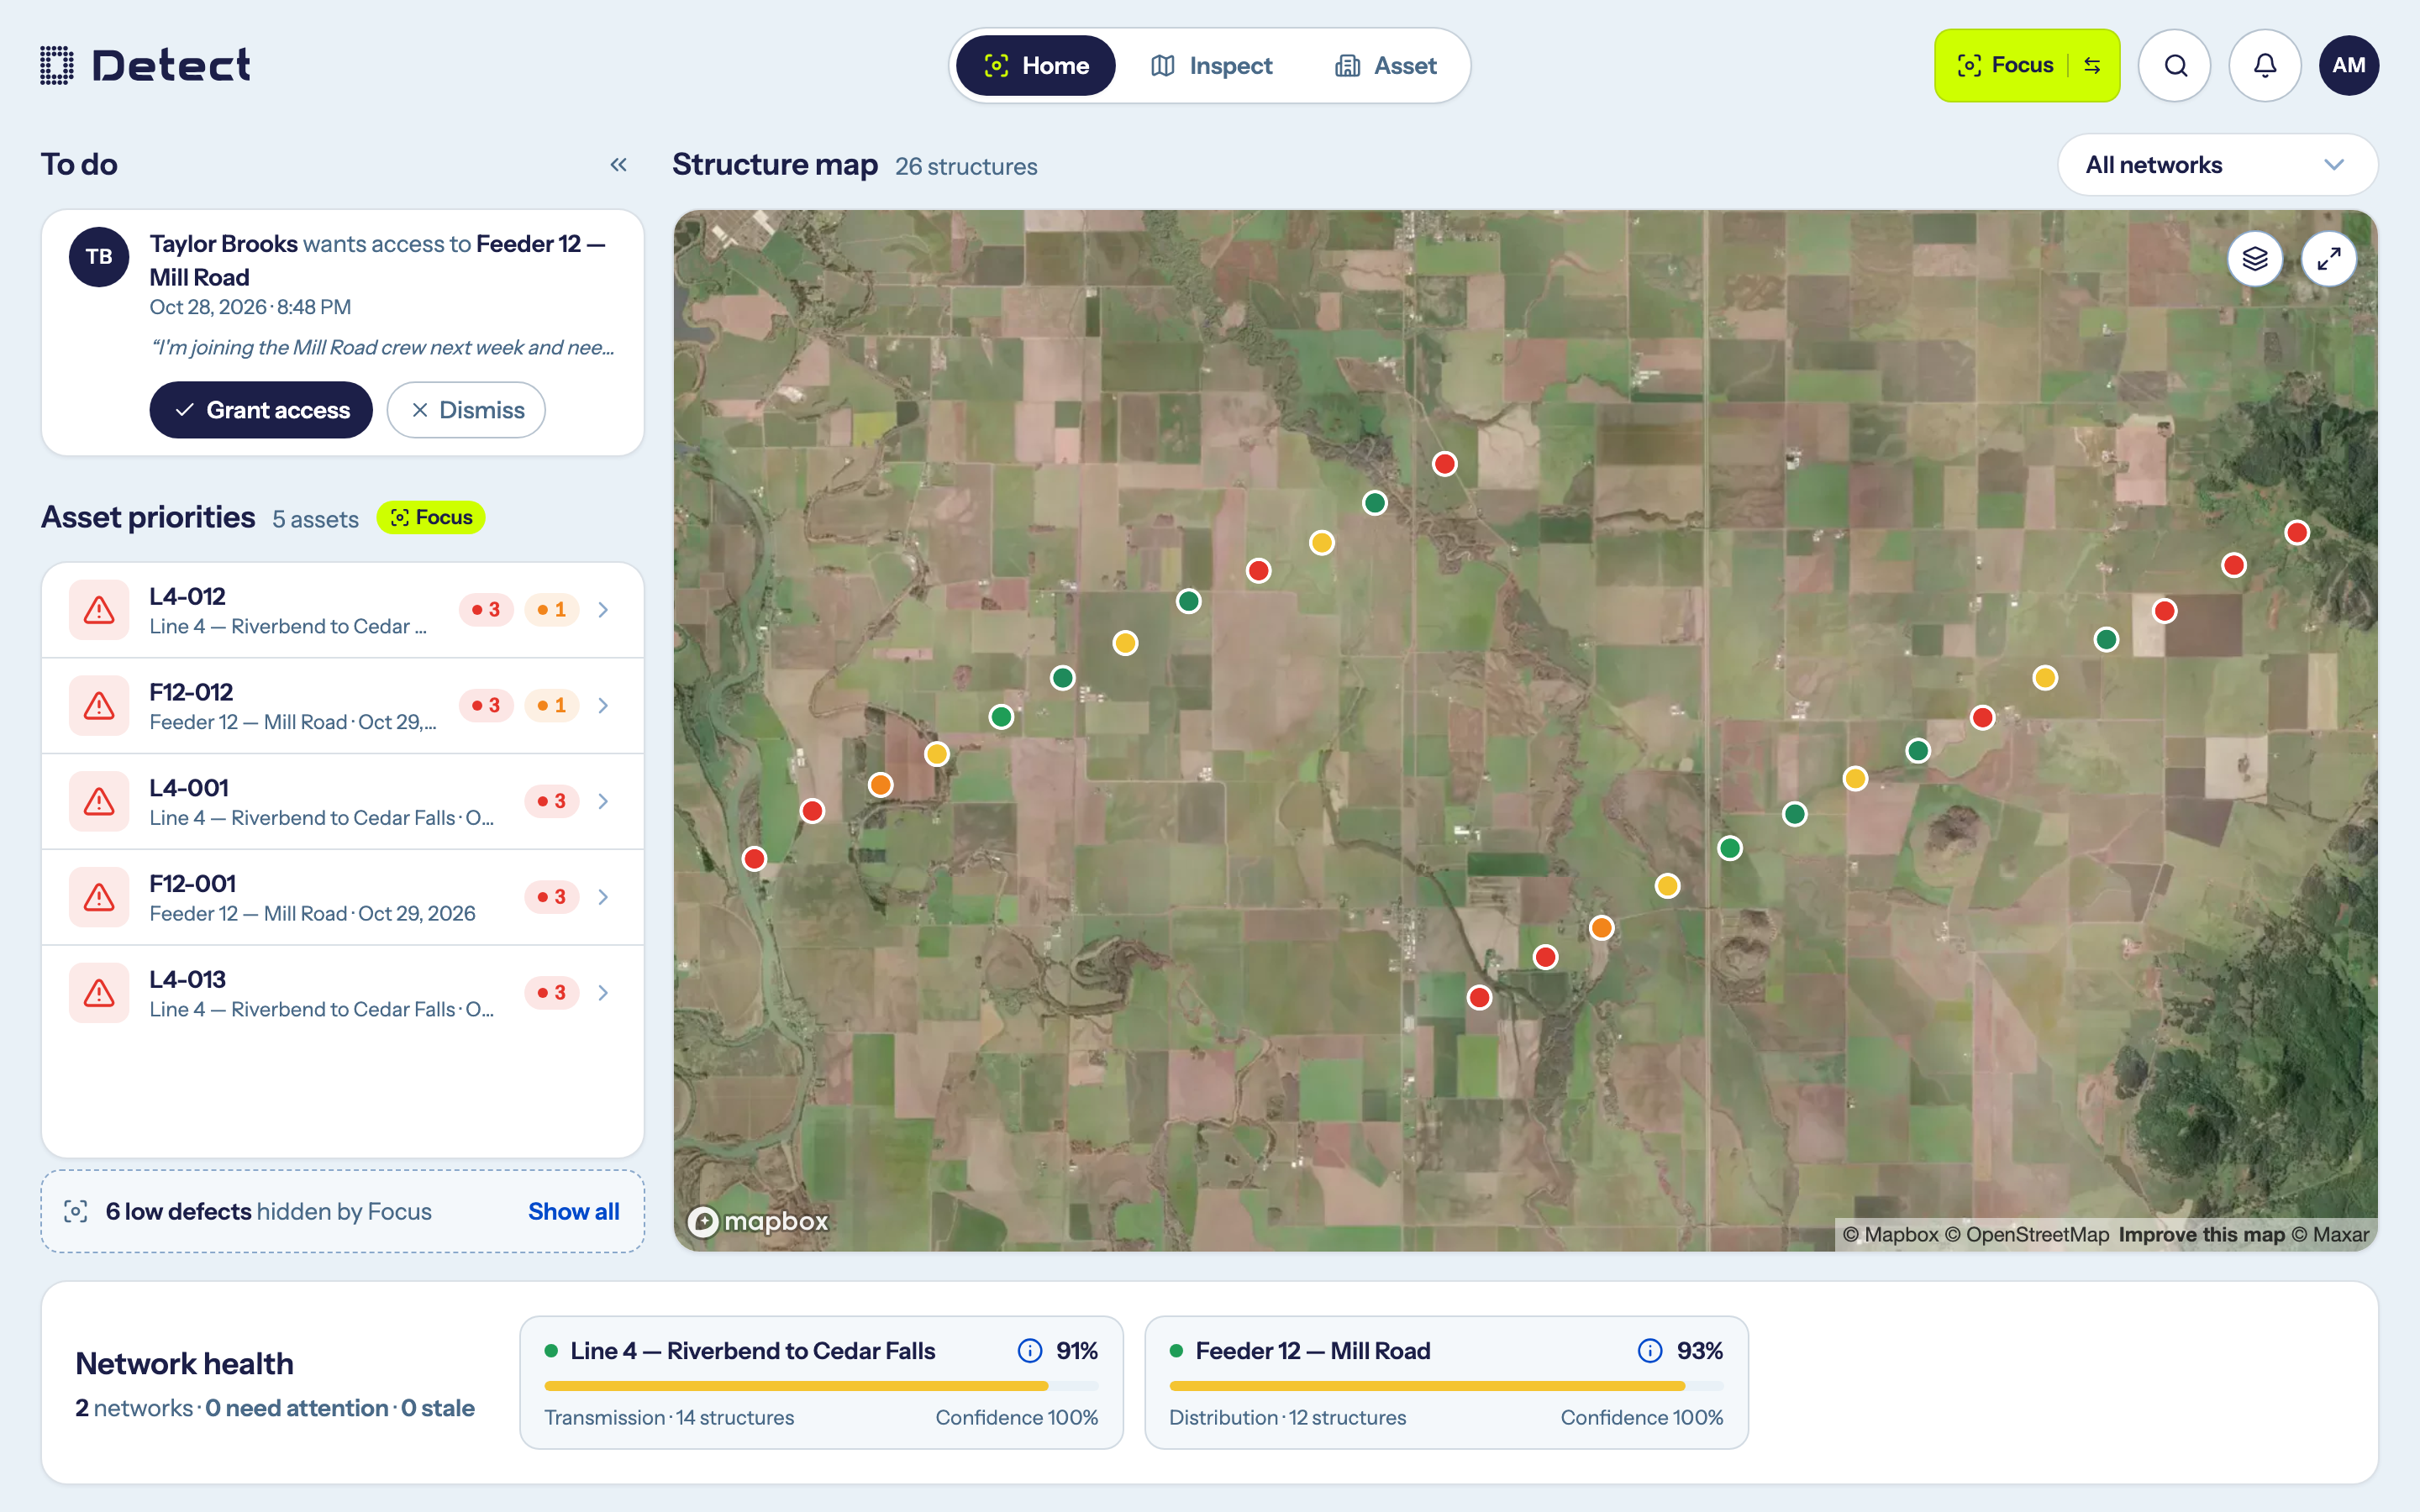
To do
The To do card lists what needs your attention. What appears depends on your role:
- Everyone new sees a Get started checklist: accept the privacy policy, add your name and role, and add a profile picture.
- Pilots see inspections waiting for images, with an Upload images button for each.
- Admins see people asking for access to your networks, with Grant access and Dismiss buttons. See Access requests.
When there is nothing to do, the card says All caught up!
Asset priorities
Asset priorities lists the structures whose health has fallen to Poor or Critical (see Key concepts), across every network you can reach. Those with the most High defects come first, then the most Medium, then the most Low; between equals, the one inspected longest ago comes first. Each row shows the structure, its network, when it was last inspected, and how many defects it has at each severity.
Click a row to open that structure in Inspect.
In Focus, the list keeps only structures with an open High or Medium defect and each row leaves out its Low count. The line under the list says what that hides, for example "6 low defects hidden by Focus": click Show all to see it.
Structure map
The Structure map shows every structure you can reach.
- Dot colors show each structure's worst open defect: red for High, orange for Medium, yellow for Low, and green for Monitor or no defects. Grey-blue means not analyzed yet. See Key concepts.
- Hover over a dot to see its condition, health, data confidence and when it was last inspected.
- Click a dot to open the structure in Inspect.
- Use the All networks menu to show one or more networks only.
- Scroll, pinch or double-click to zoom.
- Use Change map style to switch between Satellite (the default), Light and Street, and Expand map to give the map more room.
When you zoom out over a large fleet, nearby structures are grouped into clusters. Zoom in to see individual structures.
The map always shows every structure, in Focus too.
Make more room for the map
To give the whole page to the map, click the « button at the top right of the To do column, or press M. Hovering over the map's header shows the same option as Hide panels.
The panels tuck into a small bar at the top left of the map. Its icons open To do, Asset priorities and Network health as a card over the map, one at a time, and each icon's badge counts what is waiting: your to-dos, the structures in Asset priorities (as many as the list shows, so fewer in Focus), and the networks that need attention. Click the icon again, or the card's ✕, to close it.
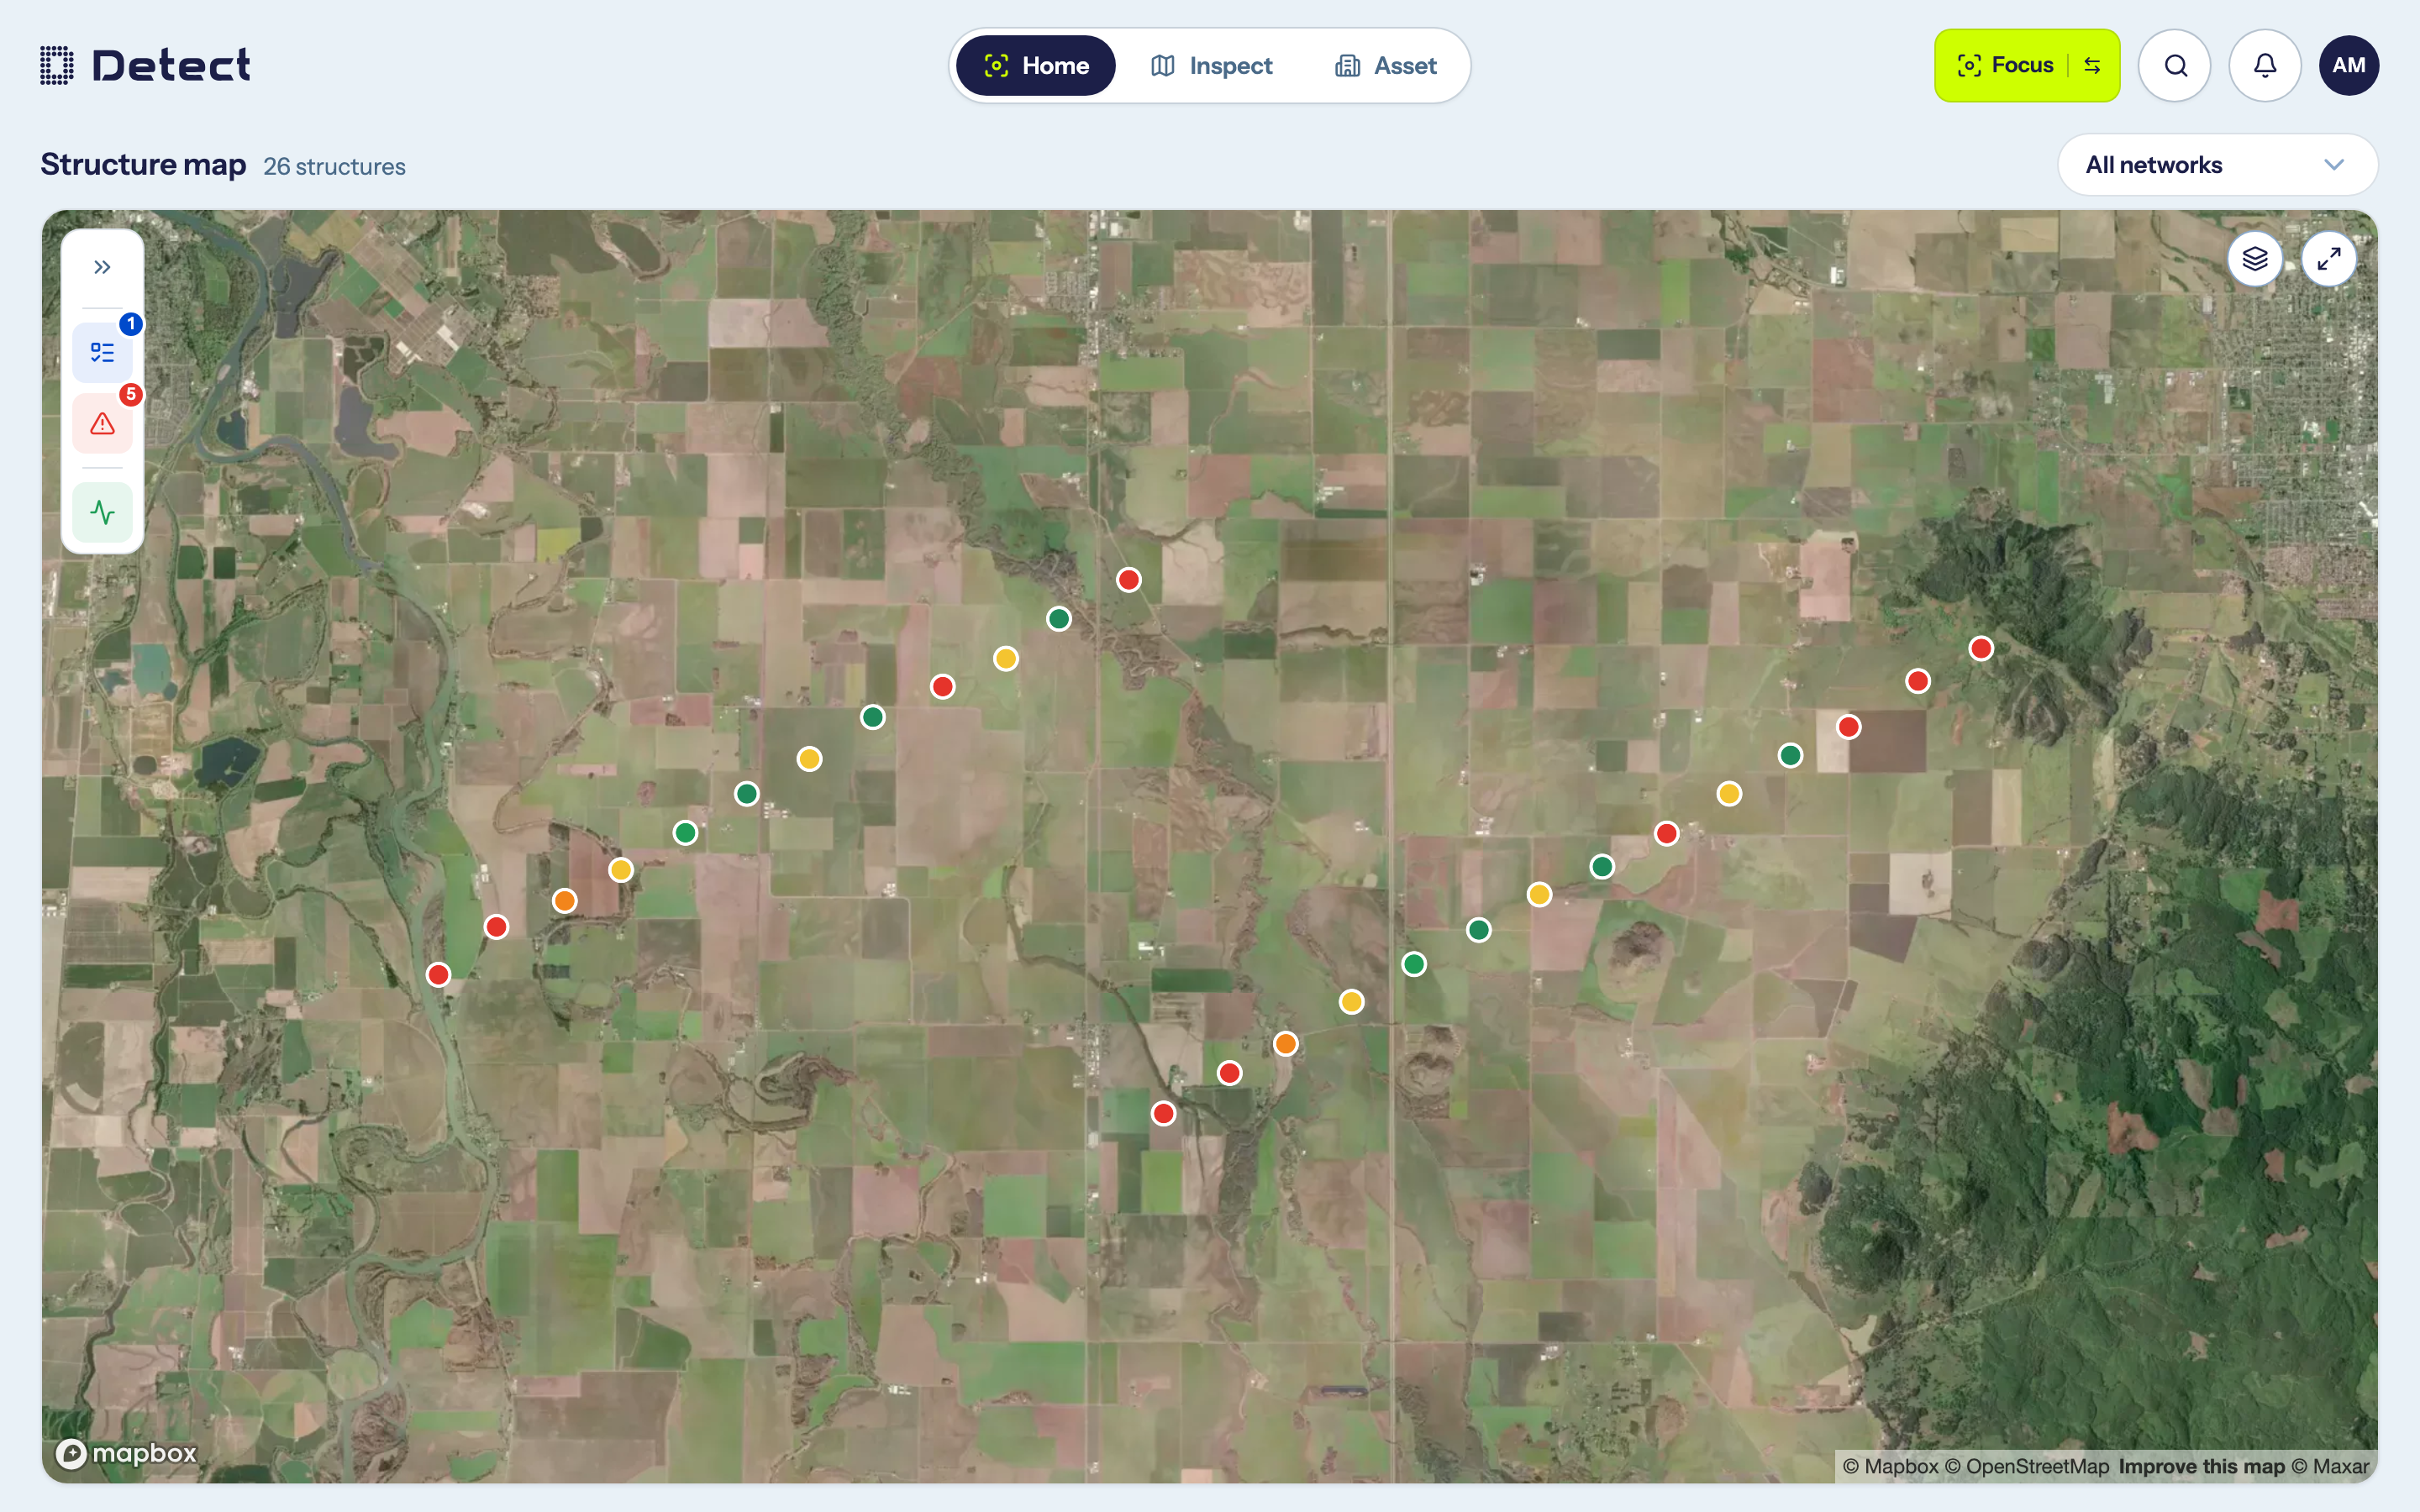
To bring the panels back, click the » button at the start of the bar, or press M again. Home always opens with its panels showing.
Network health
The strip along the bottom has a card for each network, lowest health first. Each card shows the network's health and data confidence. Click Show calculation to see how the score was worked out, or click the card to open the network in Inspect.
If your map is empty
| Message | What to do |
|---|---|
| You don't have access to any networks yet | Your organization has networks, but none have been shared with you. Ask your Admin for access. |
| No networks yet | Detect sets up networks for your organization. Click Contact Detect if you expected to see assets. |